Thursday, March 15, 2012
Sunday, February 26, 2012
MSc 2nd Year Geoinformatics PCP
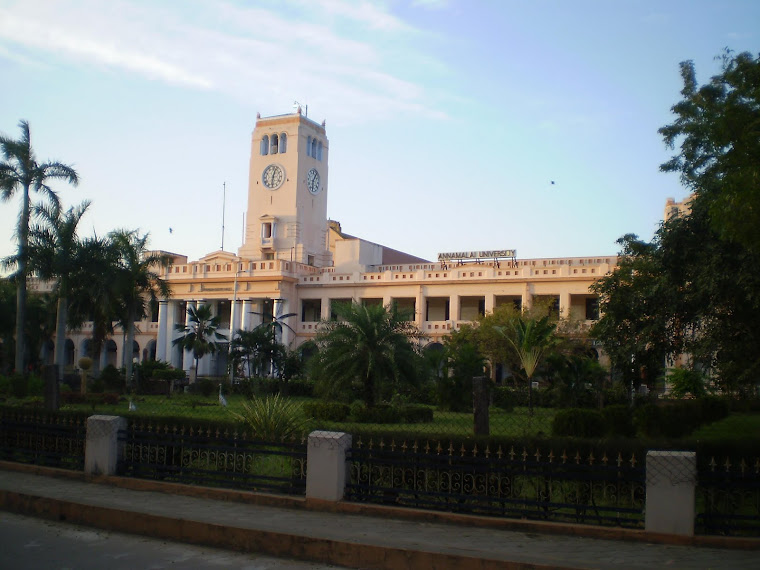
Ya we are here for the final PCP. We all are enjoying the environment of Annamalai University. On 23rd Feb, 2012 we have a grand farewell party at Earth Science Dept...It was the nice experience....Wishing this course will help all in achive their higher positions. Now we can Remotely sensed any object without touch them....Er. Vijay Kumar, hopes that this course will help in changing my life by enhancing technology in their day to day activities...
Monday, May 23, 2011
computer-assisted cartography
The use of digital computers, mapping software and computer-driven display units to design or produce maps as well as to develop databases employed in map production. Computer-assisted cartography (also called digital cartography) is somewhat older than geographical information systems, a technological specialty concerned more with the storage, retrieval and analysis of spatial data than with cartographic display per se. Because computers are used widely in all phases of cartographic design and production, the adjective computer-assisted has become somewhat redundant insofar as almost all contemporary map production is at least partly computer-assisted.
Map projections, which often require repeated evaluation of complex mathematical formulae, were among the earliest cartographic applications of the computer (Snyder, 1985). Calculation of projected coordinates preceded by several years the automatic plotting of grid lines, boundaries and other geographical features. In the 1950s geographers and planners discovered that a computer could generate a crude map on an electric typewriter or line printer designed to print alphanumeric characters aligned in six or eight rows per inch down the page and in ten columns per inch across (Tobler, 1959). Despite this coarse resolution, the widely available high-speed line printer promoted inexpensive experimentation with choropleth maps as well as the convenient display of trend surfaces and other computationally demanding isoline maps.
Display quality improved markedly in the late 1960s and early 1970s with the introduction of plotters able to raise or lower a ballpoint or liquid-ink pen and draft curved lines by moving it simultaneously in the X and Y directions. Adept at drawing lines and labels, pen-plotters could also produce crude line-pattern area symbols for choropleth and land-use maps (Monmonier, 1982). Although the digital plotter never rivaled the ink pen or engraving tool in the hand of a skilled drafter, development of high-resolution large-format film plotters in the late 1970s provided efficient machine-controlled generation of photographic negatives used in colour printing. Government agencies and large commercial mapping firms that could afford the massive investment began to abandon drafting pens in favour of the digitizers and electronic scanners required for the \'capture\' or \'conversion\' (see digitizing) of digital cartographic data. Despite high initial costs, cartographic databases promised less expensive production of updated editions as well as increased cost recovery through secondary uses (Morrison, 1980).
Further advances in display technology in the 1980s encouraged university cartographic laboratories and other small map producers to abandon manual, non-electronic drafting. Improved cathode ray tubes and highly interactive illustration software allowed rapid placement of symbols and labels as well as efficient map editing. Toner replaced ink with the advent of high-resolution laser printers able to integrate precise, aesthetically pleasing type with crisp linework and carefully controlled graytones. Page-layout software and ultra-high-resolution imagesetters revolutionized publication design and pre-press production in the 1990s, when publishers began to require electronic versions of authors\' text and graphics. Further change is inevitable as a consequence of colour monitors, inexpensive colour printers and the World Wide Web, which supports broad dissemination without the expense and delay of printing.
Digital computing and electronic display challenged cartographers to automate two basic operations: label placement and line generalization. Label placement proved more straightforward: priority rankings describing preferred locations for feature-and placenames allowed algorithms to not only avoid overlapping labels but also provide aesthetically acceptable solutions that maximized the number of labeled features ( Jones, 1997, pp. 259-62). By contrast, line generalization proved an enigmatic problem with many facets and richly varied solutions. Although computerized strategies allow mapmakers to smooth and simplify line symbols, eliminate inconsequential point and area features, purge extraneous points from the list of coordinates, consolidate nearby polygons and exaggerate details for clarity, manual intervention is almost always necessary when a substantial reduction in scale demands lateral displacement of close, similarly aligned features (McMaster and Shea, 1992).
Other noteworthy developments include specialized data structures for the efficient storage and ready retrieval of spatial data (Laurini and Thompson, 1992); geocoding schemes for representing the topological structure of the urban street grid and census enumeration units (Trainor, 1990); more efficient methods for displaying and analysing terrain (Raper, 1989) and tools for automated line-following, edge-matching and other aspects of developing and maintaining a geographical database. Also important are graphical interfaces that promote the integration of mapping with a variety of computational processes, including automated recognition of disease clusters (Openshaw et al., 1987), simulation of toxic plumes in groundwater or atmosphere, and identification of shortest-path highway routes. Optimal routing is a particularly useful addition to automated highway navigation systems that continually update a detailed local street map showing the vehicle\'s current location. By introducing time and motion as visual variables, interactive computer graphics and animated mapping have vastly enhanced cartographic reconstructions and simulations of complex events and processes. (MM)
References Jones, C.B. 1997: Geographical information systems and computer cartography. London: Longman. Laurini, R. and Thompson, D. 1992: Fundamentals of spatial information systems. London: Academic Press. McMaster, R.B. and Shea, K.S. 1992: Generalization in digital cartography. Washington, D.C.: Association of American Geographers. Monmonier, M. 1982: Computer-assisted cartography: principles and prospects. Englewood Cliffs, NJ: Prentice-Hall. Morrison, J.L. 1980: Computer technology and cartographic change. In D.R.F. Taylor, ed., The computer in contemporary cartography. New York: John Wiley and Sons, 5-23. Openshaw, S. et al. 1987: A Mark 1 Geographical Analysis Machine for the automated analysis of point data sets. International Journal of Geographical Information Systems 1: 335-58. Raper, J., ed., 1989: Three-dimensional applications in geographical information systems. London: Taylor and Francis. Snyder, J.P. 1985: Computer-assisted map projection research, Bulletin 1629. Reston, Virginia: US Geological Survey. Tobler, W.R. 1959: Automation and cartography. Geographical Review 49: 526-34. Trainor, T.F. 1990: Fully automated cartography: a major transition at the Census Bureau. Cartography and Geographic Information Systems 17: 27-38.
Various type of photographs for aerial photogrammetry
Vertical photo for aerial photogrammetry
A vertical photograph for aerial photogrammetry is taken with the camera pointed as straight down as possible Allowable tolerance is usually + 3° from the perpendicular (plumb) line to the camera axis. The result is coincident with the camera axis. A vertical photograph has the following characteristics:
(1) The lens axis is perpendicular to the surface of the earth.
(2) It covers a relatively small area.
(3) The shape of the ground area covered on a single vertical photo closely approximates a square or rectangle.
(4) Being a view from above, it gives an unfamiliar view of the ground.
(5) Distance and directions may approach the accuracy of maps if taken over flat terrain.
(6) Relief is not readily apparent.
Three terms need defining here; they are Principal Point, Nadir and Isocenter. They are defined as follows:
1. Principal Point - The principal point is the point where the perpendicular projected through the center of the lens intersects the photo image.
2. Nadir - The Nadir is the point vertically beneath the camera center at the time of exposure.
3. Isocenter - The point on the photo that falls on a line half- way between the principal point and the Nadir point.


Low Oblique for aerial photogrammetry
This is a photograph for aerial photogrammetry taken with the camera inclined about 30° from the vertical. It is used to study an area before an attack, to substitute for a reconnaissance, to substitute for a map, or to supplement a map. A low oblique has the following characteristics:
(1) It covers a relatively small area.
(2) The ground area covered is a trapezoid, although the photo is square or rectangular.
(3) The objects have a more familiar view, comparable to viewing from the top of a high hill or tall building.
(4) No scale is applicable to the entire photograph, and distance cannot be measured. Parallel lines on the ground are not parallel on this photograph; therefore, direction (azimuth) cannot be measured.
(5) Relief is discernible but distorted.
(6) It does not show the horizon.

High Oblique for aerial photogrammetry
The high oblique for aerial photogrammetry is a photograph taken with the camera inclined about 60° from the vertical. It has a limited military application; it is used primarily in the making of aeronautical charts. However, it may be the only photography available. A high oblique has the following characteristics:
(1) It covers a very large area (not all usable).
(2) The ground area covered is a trapezoid, but the photograph is square or rectangular.
(3) The view varies from the very familiar to unfamiliar, depending on the height at which the photograph is taken.
(4) Distances and directions are not measured on this photograph for the same reasons that they are not measured on the low oblique.
(5) Relief may be quite discernible but distorted as in any oblique view. The relief is not apparent in a high altitude, high oblique.
(6) The horizon is always visible.
Trimetrogon for aerial photogrammetry

This is an assemblage of three photographs taken at the same time, one vertical and two high obliques, in a direction at right angle to the line of flight. The obliques, taken at an angle of 60° from the vertical, side lap the vertical photography, producing composites from horizon to horizon.
Multiple Lens Photography for aerial photogrammetry : These are composite photographs taken with one camera having two or more lenses, or by two or more cameras. The photographs are combinations of two, four, or eight obliques around a vertical. The obliques are rectified to permit assembly as verticals on a common plane.
Convergent Photography for aerial photogrammetry: These are done with a single twin-lens, wide-angle camera, or with two single-lens, wide-angle cameras coupled rigidly in the same mount so that each camera axis converges when intentionally tilted a prescribed amount (usually 15 or 20°) from the vertical. Again, the cameras are exposed at the same time. For precision mapping, the optical axes of the cameras are parallel to the line of flight, and for reconnaissance photography, the camera axes are at high angles to the line of flight.
Panoramic for aerial photogrammetry: The development and increasing use of panoramic photography in aerial reconnaissance has resulted from the need to cover in greater detail more and more areas of the world.(1) To cover the large areas involved, and to resolve the desired ground detail, present-day reconnaissance systems must operate at extremely high-resolution levels. Unfortunately, high-resolution levels and wide-angular coverage are basically contradicting requirements.
(2) A panoramic camera is a scanning type of camera that sweeps the terrain of interest from side to side across the direction of flight. This permits the panoramic camera to record a much wider area of ground than either frame or strip cameras. As in the case of the frame cameras, continuous cover is obtained by properly spaced exposures timed to give sufficient overlap between frames. Panoramic cameras are most advantageous for applications requiring the resolution of small ground detail from high altitudes
Photogrammetry Equipments Various Types of Camera for Aerial Photogrammetry
Here you will find detailed discussion over photogrammetry equipments various types of cameras. There is two type of cameras are available Metric and Non Matric aerial photogrammetry camera.
Metric Camera for Aerial Photogrammetry
Metric cameras are those manufactured specially for photogrammetric applications.

Non Metric Camera for Aerial Photogrammetry

Digital close range Photogrammetry (DCRP)
It is the latest development in Photogrammetry, which is especially used to obtain 3D spatial information about objects placed near the camera
Subscribe to:
Posts (Atom)